


The City of Cape Town is pleased to announce that Cape Town’s most popular beaches show world-class water quality results ahead of the summer festive season. This is based on independent analysis of water samples. Furthermore, the City will, from today until the end of January 2025, provide weekly updates – named a Summer Dashboard – on the 10 latest water quality results for each of the 30 most popular beaches along the coastline. The Summer Dashboard is available on the City’s website for easy access and transparency, and provides the enterococci counts, which is the international recognised gold standard indicator for coastal water quality in terms of associated risk to human health.
Once again, Cape Town is getting ready for a bumper tourist season with world-class water quality results for Cape Town’s 30 most popular beaches.
The data is presented in the Summer Dashboard on the City’s website, and includes the enterococci counts for the last 10 samples taken at each of these 30 recreational nodes.
• 100% of the 120 water samples taken over the last month showed water quality within recreational use guidelines across these 30 most popular beaches
• For the last 300 test results dating to August 2024, only 2,3% exceeded the upper limit of 240, usually due to a rainfall event or isolated pollution incident
The intention of the Summer Dashboard is to inform residents and visitors of the most recent and relevant sample results in a manner that is convenient and transparent. It is also a useful reference point for those who are interested in the water quality patterns at their favourite beach nodes during the festive season.
Cape Town beaches offer world-class water quality ahead of festive season
The City of Cape Town is pleased to announce that Cape Town’s most popular beaches show world-class water quality results ahead of the summer festive season. This is based on independent analysis of water samples. Furthermore, the City will, from today until the end of January 2025, provide weekly updates – named a Summer Dashboard – on the 10 latest water quality results for each of the 30 most popular beaches along the coastline. The Summer Dashboard is available on the City’s website for easy access and transparency, and provides the enterococci counts, which is the international recognised gold standard indicator for coastal water quality in terms of associated risk to human health. Read more below:
The high resolution Summer Dashboard is available here: https://bit.ly/49ilhx6
The Summer Dashboard is available on the City’s website, click here: https://bit.ly/4dHk18h
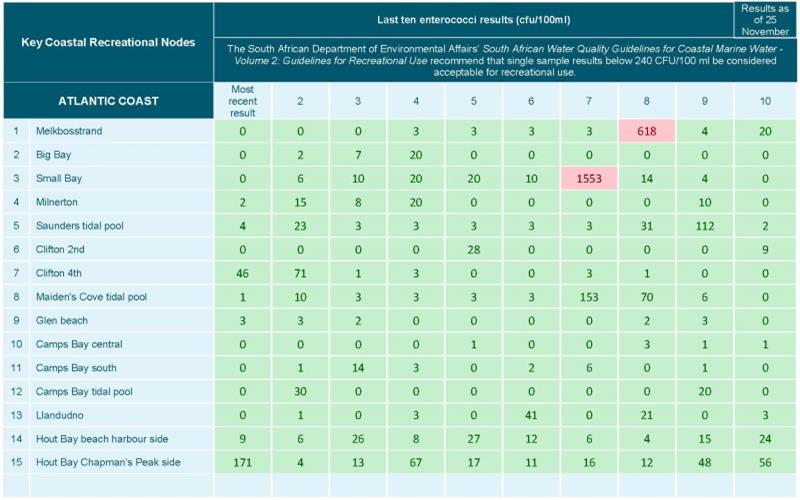
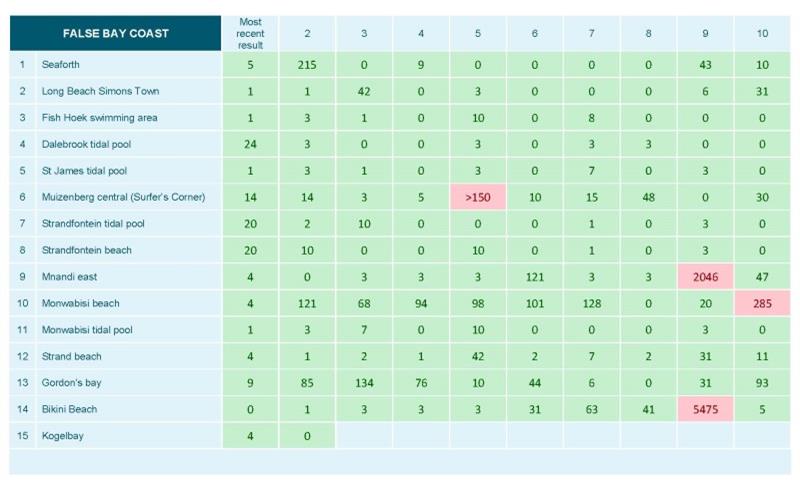
The Summer Dashboard provides the weekly enterococci results for the 30 most popular recreational beaches:
• Atlantic coastline: Melkbosstrand; Big Bay, Small Bay; Milnerton; Saunders tidal pool; Clifton 2nd; Clifton 4th; Maiden’s Cove tidal pool; Glen Beach; Camps Bay central, Camps Bay south; Camps Bay tidal pool; Llandudno; Mariners Wharf Hout Bay; Chapman’s Hout Bay
• False Bay coastline: Seaforth; Long Beach Simon’s Town; Fish Hoek swimming area; Dalebrook tidal pool; St James tidal pool; Muizenberg central (Surfer’s Corner); Strandfontein tidal pool; Strandfontein beach; Mnandi east; Monwabisi beach; Monwabisi tidal pool; Strand beach; Gordon’s Bay; Bikini beach; Kogel Bay
Included in the dashboard are:
• The results for the last 10 samples taken at these nodes. Thus, it gives the public a view of the water quality over the past two-and-a-half months at these recreational nodes
• The data (number) indicates the number of enterococci bacteria measured per 100ml, as is the standard way of reporting
• An individual count of <240 (less than 240) is regarded as sufficient for recreational purposes
• As new results come in, the oldest result will be removed and the latest added
Importantly: Water quality data is not real time data as the results are only available about four days after the sample has been taken.
We do know, however, that after rainfall events and due to the flushing of the catchments, the water quality usually declines for short periods. This is a common phenomenon in urban areas around the world, but as it currently stands, Cape Town’s coastal water quality is of a very high standard at our popular beaches.
Summary research reports on water quality at Camps Bay, Green Point, and Strand beach
Over the last 12 months, intensive high frequency research water sampling has been undertaken at a number of beaches. These research summary reports on water quality at these locations are now available on the City’s website at: https://bit.ly/4dHk18h
The reports detail:
-
The outcome of 371 sampling tests over the last 12 months from four locations at Camps Bay beach – the results show consistently high water quality at this beach throughout the year
-
The outcome of daily sampling at the Green Point pump station from August 2024 to November 2024 – the results are ‘good’, and confirm there is no wastewater discharge from the old outfall pipe
-
The outcome of weekly sampling between October 2023 and November 2024 and daily sampling (Monday to Friday) from 23 September 2024 to 22 November 2024 at the Strand swimming area and Strand surfing area, colloquially referred to as ‘Pipe’. The results for both locations indicate these nodes meet the standards for recreational use during summer when no rainfall events have occurred.
The summary report for Hout Bay is being finalised and will be published on the City’s website as soon as it is ready.
The public is encouraged to go online, and peruse the Summer Dashboard to find out more about the water quality at their favourite beaches over the festive period and to engage with the research reports.
For further information on Coastal Water Quality in Cape Town, please consult the following FAQs document on the City’s website.
• Those interested in the results for other recreational nodes and coastal monitoring points can find the latest data on the City’s website. The data is updated weekly, visit the Coastal Water Quality page at: https://bit.ly/4dHk18h
